Excel Inventory Forecasting: Tips, Tricks, & Techniques
Learn how to make your inventory forecasting in Excel easier to save time and minimize mistakes with helpful techniques and tips.
Updated July 5, 2024.

Accurate inventory forecasting can help you reduce inventory waste, prevent obsolete inventory in your Shopify store, and promote financial health by ensuring adequate stock levels are always available.
Inventory forecasting, or eCommerce forecasting, helps eCommerce store owners better manage their inventory by predicting future product demand based on real-time inventory trends and historical metrics, such as past sales data.
To reap the benefits of accurate inventory forecasting, such as supply level optimization and refined pricing and sales strategy, you can try what many brands do and use Microsoft Excel to conduct your inventory forecasts.
However, while Excel can give you useful insights into sales trends and demand changes, it can be difficult to determine exactly how to forecast inventory using this tool. In this post, we discuss helpful techniques and tips to simplify the process and make inventory forecasting in Excel more manageable.
» Want to optimize your stock levels for better profitability? Learn how to supercharge your Shopify inventory forecasting
How to Forecast Inventory in Excel: 3 Techniques
Excel is a popular tool for demand forecasting because it's cost-effective and can use conditional formatting. Although it can be error-prone and a bit time-consuming, it can still be an effective inventory forecasting tool that can ultimately help you improve your inventory turnover if you know how to use it properly.
1. Moving Average
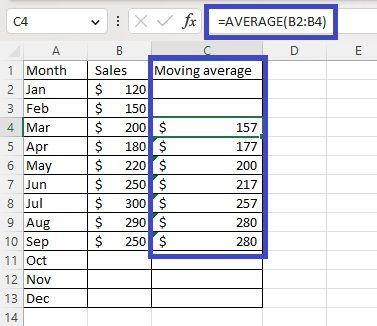
The moving average method can help you predict your future inventory demand by looking at the average value of past buyer trends and patterns over a given period. This method "moves" because it considers new data. For example, if you choose to calculate your average over three months, this method will use the data from January, February, and March. But next month, the data from February, March, and April will be used instead.
Analyzing an average gives you a baseline and helps combat fluctuations that might give you an incorrect reflection of your inventory demands. You can use this formula to calculate your moving averages:
Moving average = Select the revenue earned from the current month + X number of prior months + apply this formula: =AVERAGE(Data Range)
2. Linear Regression
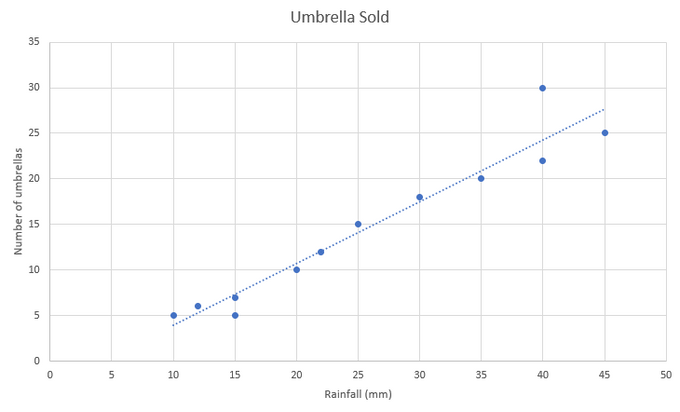
The linear regression technique predicts demand by comparing two different variables—for example, the number of umbrellas sold vs. rainfall amounts. In this example, if you're forecasting umbrella sales, you'd use the rainfall amount as your independent variable and compare it to the number of umbrellas sold over a certain period to predict future demand more accurately.
To employ linear regression in Excel, follow these steps:
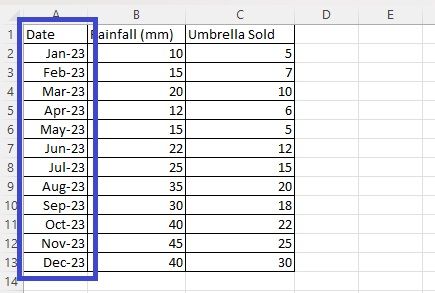
- Create three columns and choose one to contain each of the 12 months.
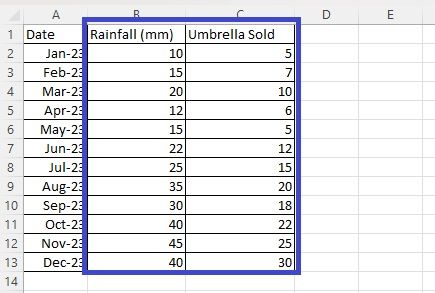
- Fill the other two columns with data related to the variables you wish to examine (e.g., rainfall in millimeters and the number of umbrellas sold).
- Select the two columns with data and insert a scatter chart into your spreadsheet.
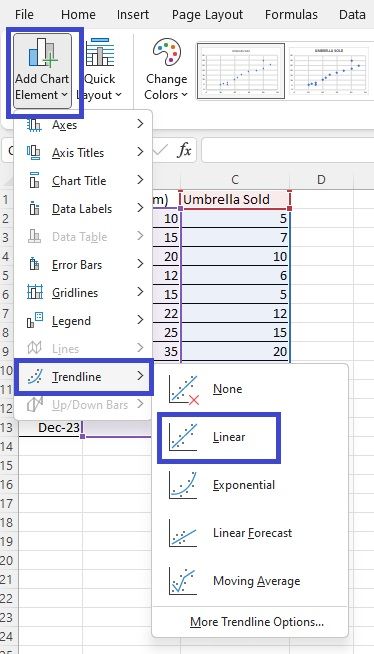
- Add a linear trendline to the data points.
- Your finished graph should resemble this.
3. Exponential Smoothing
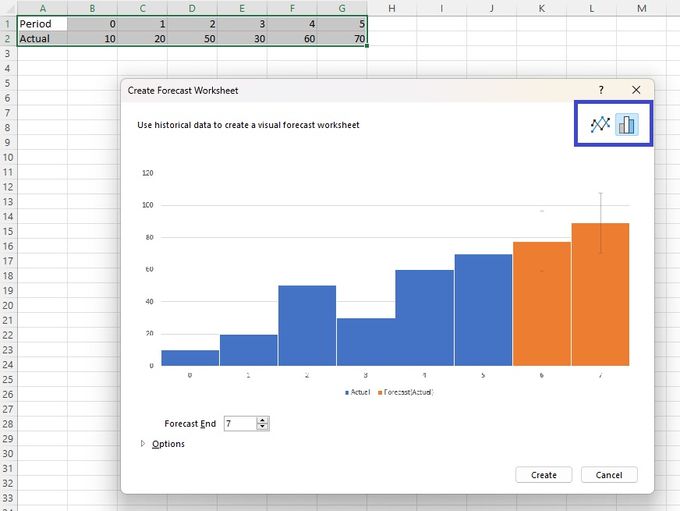
Exponential smoothing predicts demand by smoothing out historical data, such as seasonality patterns and confidence intervals. Follow these steps to implement this technique yourself:
- Go to the Data menu in Excel.
- Select Forecast Sheet.
- Pick a suitable chart (e.g., column or line chart).
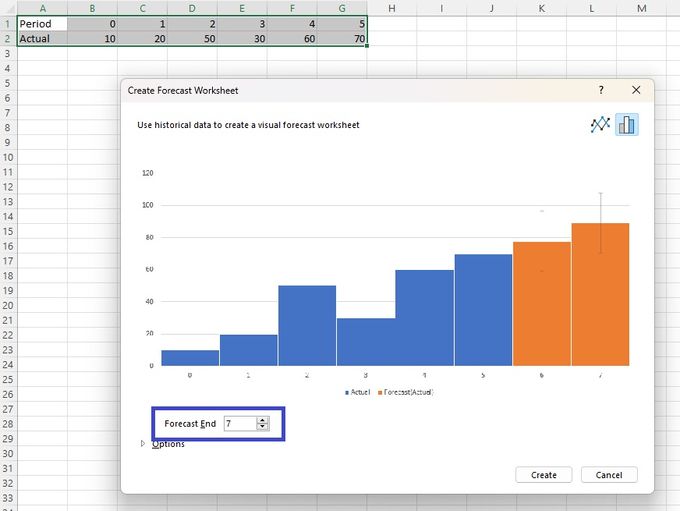
- Select your end forecast date.
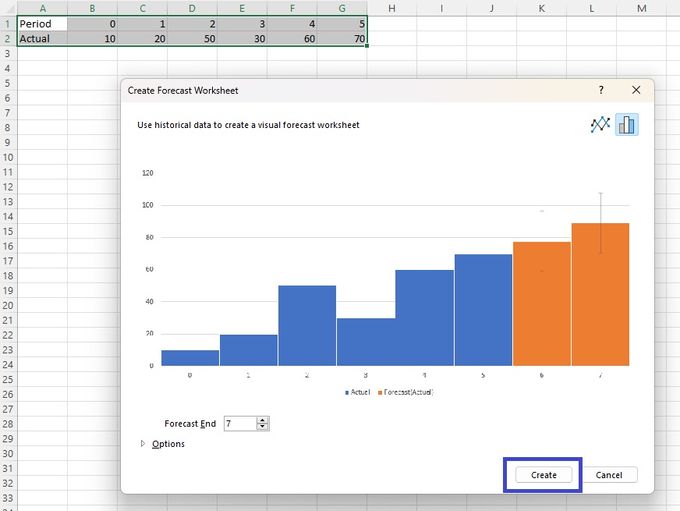
- Click Create to generate a worksheet with a sales forecast.
» For more accurate forecasts, consider your pipeline inventory as well
3 Tips to Optimize Basic Excel Inventory Forecasting
When using Excel for inventory forecasting, the data isn't always perfect, as it can only give you static information. However, you can make the most of Excel's features by optimizing your inventory forecasting using the following tips:
1. Customize Visual Data
Excel offers several customization options that you can use to optimize your inventory forecasting and avoid having to get rid of obsolete inventory. For example, you can tailor the visual timeline for specific ranges with color coding and other visual cues that make it easier to understand the data at a glance.
2. Choose a Suitable Forecast Function
While creating inventory forecasts in Excel, you'll be able to use different forecast functions to guide your forecast predictions, such as:
- FORECAST: Predicts a future value with linear regression.
- FORECAST.LINEAR: Has the same purpose as FORECAST, just for newer versions of Excel.
- FORECAST.ETS: Used for exponential smoothing.
- FORECAST.ETS.SEASONALITY: Calculates the length of a recurring pattern in a timeline to detect seasonality.
- FORECAST.ETS. CONFINT: Calculates the confidence interval for a forecasted value.
- FORECAST.ETS.STAT: Determines a specific value based on exponential smoothing forecasting.
3. Rely on Third-Party Apps and Templates
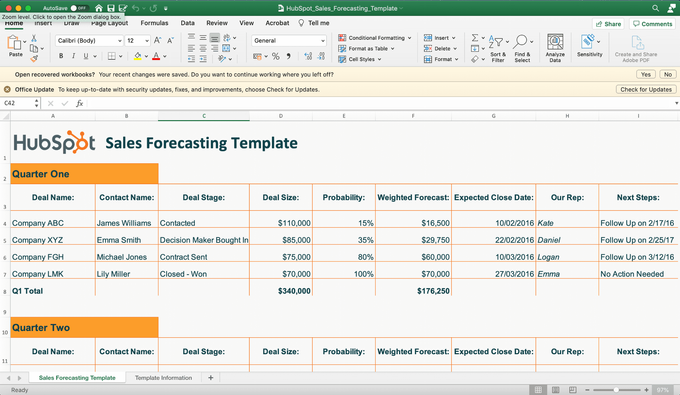
Finally, you can also leverage Excel's existing functionalities with third-party software and pre-made forecasting templates. You can simplify the whole process by using tools like Asana, Salesforce, and Monday.com or downloading free inventory forecasting Excel templates like this one from HubSpot.
» Discover how bulk management could further refine your strategies
Why You Should Upgrade From Excel to Achieve Enhanced Inventory Management
Excel has been a popular choice for inventory forecasting for a long time, but as your business grows and sales patterns get more complicated, it can start to show its limitations. Here are some of the main issues with using Excel for modern inventory management:
- It doesn't scale well: As your product range expands, Excel can struggle with large amounts of data, which can lead to slower performance and potential inaccuracies.
- It takes a lot of time: Entering data manually and analyzing it in Excel can be extremely time-consuming. Not only does this slow things down, but it also increases the chances of human error, which can affect the accuracy of your data.
- It's not very automated: Excel requires manual updates and can't automate data processing tasks, which makes it inefficient for managing inventory that's constantly changing.
» Learn how to automate your inventory management in Shopify
After setting up a basic forecast in Excel, moving to specialized Shopify apps like Bestsellers reSort and Order to Discount can make your inventory management much more efficient. This software can:
- Organize and analyze sales data: These apps can handle complex datasets easily, organizing and analyzing your sales data more effectively. This helps you build a stronger forecasting system so you can make informed decisions based on accurate, up-to-date information.
- Automate repetitive tasks: You can automate important but repetitive tasks like sorting products based on sales data. This saves you time and ensures that your inventory is always organized in the most optimal way.
- Optimize your stock levels: These apps can help you spot inventory that's not selling as quickly as you'd like. This way, you can create special promotions to clear out excess stock. By doing this, you can keep your stock levels in check and avoid the extra costs that come with holding on to too much inventory.
» Looking for a way to reduce inventory waste and optimize stock levels? Check out our best apps and strategies for managing your Shopify inventory
Simplify Your Excel Inventory Forecasting
Understanding how to do inventory forecasting in Excel can help you make better decisions about your stock levels and ensure you have the right products at the right time.
But while Excel can be a valuable tool for basic inventory forecasting, it's clear that relying solely on spreadsheets can hold your business back as you grow. By transitioning to third-party Shopify apps, you can take your inventory management to the next level. These apps offer potent features that Excel simply can't match—from automated data analysis to intelligent stock optimization.
» Ready to streamline your operations? Take your eCommerce business to new heights by embracing the power of Shopify apps
